








How to Monitor and Maintain Catalytic Filtration Media Performance
Catalytic filtration media can provide reliable removal of iron, manganese, arsenic, uranium, and other contaminants when the filter is operated within its intended conditions. Its performance depends on more than the media itself. Water chemistry, flow velocity, contact time, backwashing, pretreatment, and the quality of routine measurements all influence treatment results.
A filter may appear to be working normally while its capacity is gradually declining. Rising pressure loss, breakthrough at the outlet, reduced flow, or changes in raw-water chemistry can provide early evidence of trouble. A structured monitoring program helps operators identify these signals before they become a compliance issue or cause damage to downstream equipment.
The most effective approach combines operational data with laboratory testing and clear maintenance records. This makes it easier to distinguish exhausted media from fouling, hydraulic problems, poor backwashing, or a change in the contaminant load.
Why Media Performance Changes
Catalytic media works through surface reactions, adsorption, oxidation, filtration, or a combination of these mechanisms. Media designed for manganese removal may depend on suitable pH, dissolved oxygen, and oxidation conditions. Media used for arsenic or uranium can have different selectivity and capacity limits. For this reason, monitoring should always follow the specifications for the particular product and application.
Over time, suspended solids, natural organic matter, iron deposits, and biological growth can block active surfaces. In other cases, media grains may become compacted, worn, or displaced. Channeling is another concern: water finds preferential paths through the bed and avoids much of the available treatment surface. The outlet can then show contaminant breakthrough even though part of the media remains active.
Chemical-free operation does not mean maintenance-free operation. Correct hydraulic loading and regular backwashing are essential for removing captured solids and restoring bed expansion. If backwashing is too weak, fouling accumulates; if it is too aggressive, media may be lost through the drain or become stratified incorrectly.
Set Baseline Operating Data
A useful monitoring program begins immediately after commissioning. Record influent and treated-water concentrations for the target contaminants, along with flow rate, pressure before and after the vessel, pH, temperature, turbidity, and relevant oxidation conditions. These initial results establish the normal operating range for the installation.
Sampling should be performed at consistent points and under comparable operating conditions. A sample taken just after backwashing may not represent the same condition as one collected near the end of a filter run. Record the date and time, filter run duration, recent backwash activity, flow, and any unusual event such as a raw-water disturbance or pump change.
Keep a media inventory that includes installation date, bed depth, product type, batch information where available, and any replacement or top-up work. A clear history helps identify gradual capacity loss and supports decisions about refurbishment. Operators can also consult the company’s frequently asked questions when reviewing common operating and maintenance considerations.
Read The Main Performance Signals
Pressure differential is one of the simplest indicators of hydraulic condition. A gradual increase often points to solids accumulation or inadequate backwashing. A sudden change can indicate a blocked screen, valve problem, collapsed bed, or an abnormal solids load. Pressure should be interpreted alongside flow because a falling flow rate can hide a developing restriction.
Treated-water quality is the decisive measure of contaminant removal. Track both concentration and removal percentage for the target substance, but do not rely on a single sample. A rising trend in manganese, arsenic, uranium, iron, or turbidity may indicate exhaustion, channeling, insufficient contact time, or a change in influent chemistry.
| Measurement | Stable operating signal | Warning sign | Useful response |
|---|---|---|---|
| Differential pressure | Gradual, predictable increase between backwashes | Rapid rise or persistent high pressure | Check solids loading, valves, screens, and backwash quality |
| Flow rate | Consistent flow at the design pressure | Falling flow or unstable delivery | Inspect hydraulics and verify pump and control settings |
| Target contaminant | Effluent remains below the operating limit | Sustained upward trend or breakthrough | Confirm sampling, review chemistry, and test media capacity |
| Turbidity or suspended solids | Low and stable after start-up | Spikes after backwash or during normal service | Inspect bed settling, underdrains, and backwash sequence |
| pH, dissolved oxygen, or ORP | Within the media’s required range | Drift outside the validated range | Investigate pretreatment and adjust operating conditions |
| Backwash duration and drain quality | Clear repeatable cycle | Short cycle, poor expansion, or media loss | Verify flow, air scour, valves, and drain restrictions |
Data should be reviewed as a trend rather than as isolated readings. A control chart or simple spreadsheet can show when a parameter begins moving away from its baseline. Alarm limits should include an early-warning level and a critical action level, giving staff time to investigate before treated-water quality fails.
Use A Layered Water Quality Program
Field instruments are valuable for immediate control, but laboratory analysis is needed to confirm treatment performance. Test raw and treated water at a frequency suited to the contaminant risk, system size, and regulatory requirements. Laboratory results can validate online readings and reveal changes that a pressure gauge or turbidity meter cannot detect.
For microbial risks, filtration performance should be considered as part of a broader barrier strategy. Catalytic media intended for metals or specific chemical contaminants should not automatically be treated as a complete disinfection process. Where bacteria control is required, operators should evaluate the complete treatment train, including validated membrane or disinfection stages. Background on ultrafiltration for bacteria can help explain how a separate barrier may complement other filtration technologies.
Water chemistry deserves special attention after seasonal or operational changes. Rainfall, groundwater recharge, agricultural activity, industrial discharge, well-depth changes, and altered pumping patterns can affect contaminant concentration and pH. Test the influent when performance shifts instead of assuming that the media has reached the end of its service life.
Diagnose Loss Of Capacity
When effluent quality worsens, begin by checking the measurement process. Confirm sample locations, laboratory methods, instrument calibration, and whether the sample was collected during a stable service period. A faulty sensor or inconsistent sampling can lead to unnecessary media replacement.
Next, compare current operating conditions with the original design. Check flow, empty bed contact time, pH, temperature, dissolved oxygen, oxidation-reduction conditions, and the contaminant loading. A higher flow or a lower contact time can produce breakthrough even when the media remains chemically active. Likewise, a pH shift can reduce the effectiveness of a media selected for a narrower operating range.
If hydraulic data show rising pressure, inspect the backwash cycle. Verify actual backwash flow rather than relying only on a programmed duration. Confirm that the bed expands as required, that the drain is unrestricted, and that valves open fully. If the bed is uneven or channeling is suspected, a specialist inspection may be needed.
Media replacement should follow evidence from performance trends, capacity testing, physical inspection, and the supplier’s recommendations. Replacing media too early raises operating costs, while delaying replacement can expose users and equipment to poor-quality water. A sustainable treatment strategy should balance service life, water quality, energy use, and disposal requirements, consistent with a broader water treatment vision.
Actions That Protect Filter Performance
A written operating procedure makes routine care consistent across shifts and sites. It should identify sampling points, alarm limits, backwash triggers, inspection intervals, escalation contacts, and the actions required when an indicator moves outside its normal range.
Practical recommendations include:
- Record flow, pressure differential, run time, backwash data, and treated-water quality after each significant operating cycle.
- Calibrate sensors and verify laboratory sampling methods at defined intervals.
- Backwash according to measured pressure loss or validated run time, while confirming adequate bed expansion and avoiding media carryover.
- Review influent pH, turbidity, contaminant concentration, and seasonal changes whenever effluent quality begins to shift.
- Inspect vessels, valves, underdrains, screens, and sampling points during planned maintenance rather than waiting for a failure.
Operators should review the records as a team and update the baseline when equipment, source water, or treatment targets change. A short monthly review can reveal patterns that are easy to miss during daily operation, such as progressively shorter filter runs or repeated turbidity spikes after backwash.
Reliable monitoring turns catalytic filtration from a set-and-forget device into a controlled treatment process. For a site assessment, media selection review, or maintenance strategy, contact Swiss Cleanwater Group with the system design, recent water analyses, operating data, and maintenance history. That information allows the treatment approach to be evaluated against actual conditions and helps protect clean-water performance over the long term.
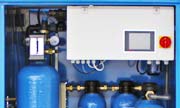
SCM 24
|
|
Cleans 24.000 liters per day
|
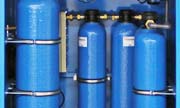
SCM 60
|
|
Cleans 60.000 liters per day
|
Video: How it works
The SCG Advantage
Our market-leading, water cleaning solutions have many advantages. To read more click the items below:
No Chemicals
Our machines and technology does not use any chemicals, at all.
Read more...
No Waste Water
Our machines do not waste any water. Yield = 100%.
Read more...
Low energy use
Uses 50 times less energy than a Reverse Osmosis Machine.
Read more...
Low ownership cost
Lower maintenance and operation costs due to our technology.
Read more...
Easy to install
Simple "plug and play" installation makes for easy deployment.
Read more...
Extremely compact
A compact system, contained in an easy to transport cabinet.
Read more...
Outperforms R.O.
SCG technologies outperform Reverse Osmosis systems.
Read more...
Faster ROI
Get a faster Return on Investment with our systems.
Read more...
Latest News
Latest Blog Posts
| Chemicals in water treatment? |
| Water storage - Whats best for keeping water clean and drinkable? |
| Case: Disaster Management Water Treatment |
Contact SCG
891 Showroom Place
Suite 101
Chula Vista, CA, 91914
Phone: +1 619-878-2730
Contact us by email