









What Water Treatment Really Costs Over Its Service Life
The purchase price of a water treatment system tells only part of the financial story. A plant that appears inexpensive at installation can become costly when chemical supplies, replacement media, energy consumption, sludge handling, specialist servicing, and regulatory monitoring are added over several years.
Chemical-free water treatment changes the cost structure. Instead of relying on continuous dosing to control contaminants, many modern systems use physical filtration, adsorption, catalytic processes, oxidation, or membrane separation designed to reduce chemical inputs and waste. The most suitable approach depends on the raw water, target contaminants, flow rate, and required water quality.
A proper lifecycle assessment therefore compares total ownership cost rather than equipment price alone. Municipal networks, farms, industrial facilities, buildings, and mobile installations each have different operating patterns, yet the same principles apply: measure every recurring expense, account for maintenance, and consider the financial value of reliable clean water.
What Lifecycle Cost Includes
The lifecycle cost of a treatment plant begins with design and installation. Engineering surveys, pilot testing, civil works, pipe modifications, electrical connections, controls, storage tanks, and commissioning can all influence the initial investment. A solution selected after a water analysis is usually more predictable than a standard unit installed without understanding seasonal variation.
Operating expenditure becomes more important after commissioning. Traditional systems may require disinfectants, coagulants, pH correction chemicals, antiscalants, or regeneration salt. These materials must be purchased, stored, transported, dosed, and monitored. Their prices can fluctuate, and some sites need special handling procedures to protect workers and the environment.
Maintenance also deserves close attention. Pumps, dosing equipment, valves, sensors, membranes, filter media, and ultraviolet lamps have different replacement cycles. A lifecycle model should include planned service as well as unplanned downtime, emergency callouts, water disposal, and production losses when the system is offline.
Where Chemical-Free Systems Can Reduce Spending
Chemical-free purification can lower recurring costs by reducing or eliminating consumables. A system that does not need continuous dosing may require fewer deliveries, less chemical storage, and simpler operator routines. It can also reduce the administrative burden associated with safety data, handling procedures, and chemical inventory management.
Waste management is another major factor. Conventional treatment may create concentrated brine, chemical sludge, spent regenerant, or contaminated containers. Disposal costs vary by location and contaminant, and industrial sites may face additional compliance requirements. Technologies that achieve contaminant removal with limited waste can improve both operating economics and environmental performance.
Energy demand should be assessed rather than assumed. Some chemical-free systems use low-pressure filtration or gravity-assisted flow, while others require pumps, aeration, ultraviolet disinfection, or high-pressure membranes. A useful comparison includes kilowatt-hours per cubic metre, peak-load charges, pump efficiency, and the cost of maintaining water pressure across the site.
A reverse osmosis comparison can be particularly useful when evaluating membrane-based alternatives. Reverse osmosis may be appropriate for dissolved salts and difficult contaminants, but its energy use, concentrate stream, pretreatment needs, and membrane replacement schedule should be included in the full financial calculation.
Comparing the Main Cost Drivers
The right system is determined by the contaminants that must be removed. Manganese, arsenic, uranium, pesticides, bacteria, hardness, and dissolved salts do not respond equally to the same process. Choosing equipment based on a broad label such as “water purifier” can result in underperformance, premature media exhaustion, or unnecessary treatment stages.
Flow rate is equally important. Equipment sized for average demand may struggle during peak use, while an oversized plant can carry unnecessary capital and energy costs. Contact time, pressure, loading rate, backwash frequency, and filtration velocity affect removal efficiency and operating stability. Guidance on flow-rate performance helps connect hydraulic design with treatment results.
The comparison below shows the categories that should be included in a financial model. Actual values vary according to raw-water quality, local electricity and chemical prices, operating hours, discharge rules, and the required level of automation.
| Cost category | Traditional chemical-based system | Chemical-free or low-chemical system |
|---|---|---|
| Initial investment | Often moderate, though dosing, storage, and safety equipment add cost | May require specialized filtration, controls, or pretreatment |
| Consumables | Ongoing chemicals, salt, antiscalant, or coagulant purchases | Usually limited to filter media, cartridges, lamps, or periodic replacements |
| Energy | Pumps, mixing, dosing, and possible membrane pressure demand | Can be low for gravity or low-pressure systems; varies by process |
| Waste handling | Sludge, brine, spent regenerant, and chemical containers may require disposal | Often less liquid or chemical waste, depending on the technology |
| Maintenance | Dosing pumps, injection points, storage tanks, and chemical sensors | Valves, pumps, media, membranes, sensors, and backwash equipment |
| Staffing and safety | Training, chemical handling, storage inspections, and compliance tasks | Simpler handling in many installations, with continued water-quality monitoring |
| Downtime exposure | Chemical shortages or dosing faults can interrupt treatment | Media exhaustion, fouling, power loss, or control faults remain possible |
| End-of-life cost | Chemical infrastructure may require decommissioning and disposal | Equipment, media, membranes, and electronic components need responsible replacement |
Reliability, Water Quality, And Risk
Lower operating cost has value only when treatment performance remains dependable. A system must consistently meet the required standard during changes in temperature, turbidity, rainfall, source-water chemistry, and demand. Monitoring should therefore cover both treated-water quality and the conditions that influence process performance.
Chemical-free does not mean maintenance-free. Filters may need backwashing, media may need replacement, and sensors require calibration. Bacterial control also requires a planned barrier strategy. In buildings with complex plumbing, low-use outlets, warm-water loops, and storage tanks, prevention and monitoring are essential. Facilities assessing chemical-free Legionella control should consider the entire water system rather than treating one piece of equipment in isolation.
Reliability can be expressed financially through avoided downtime and reduced operational risk. For a livestock operation, a treatment interruption can affect animal health and production. For a factory, it may damage process equipment or stop manufacturing. For a public facility, it can create reputational and regulatory consequences. These costs may exceed the direct price of water treatment.
Building A Practical Financial Model
A useful model starts with the volume of water treated each day and the expected operating life of the equipment. Add capital expenditure, installation, commissioning, annual service, energy, consumables, laboratory testing, waste disposal, spare parts, and planned component replacement. Apply realistic inflation to electricity, chemicals, labour, and transport instead of assuming constant prices.
The model should also include a sensitivity analysis. Test what happens if the raw-water contaminant concentration rises, demand doubles during a seasonal period, electricity prices increase, or a membrane or pump must be replaced earlier than expected. This reveals whether a system remains economical under normal variation rather than only under ideal operating conditions.
Useful metrics include total cost per cubic metre, annual operating cost, payback period, net present value, and cost per unit of contaminant removed. Cost per cubic metre is easy to communicate, but it should not replace a broader evaluation of water safety, waste generation, resilience, and service requirements.
A pilot installation or detailed water analysis can improve the accuracy of the estimate. It may identify whether several treatment stages are necessary, whether a lower-pressure process is viable, and how frequently media or membranes will need service. Spending more during the design stage can prevent years of avoidable operating expense.
Choosing The Right Solution For The Site
A rural community may prioritise low maintenance and dependable operation where technical staff are limited. An industrial plant may focus on process-water consistency, wastewater obligations, and the cost of production interruptions. A building owner may value compact equipment, quiet operation, and protection against microbial risks. Military and mobile applications may need rugged systems that can operate with limited infrastructure.
The best evaluation combines technical suitability with operating practicality. Ask whether local personnel can maintain the equipment, whether replacement parts are available, how often testing is required, and what happens during a power failure. A system that performs well in a laboratory but is difficult to service in the field may have a higher real-world cost.
The following actions make a lifecycle comparison more dependable:
- Test the source water for every relevant contaminant before selecting a process.
- Measure average and peak flow rates, seasonal demand, and available pressure.
- Calculate energy, consumables, waste disposal, labour, and replacement costs over the intended service life.
- Include downtime, regulatory monitoring, safety procedures, and emergency servicing in the financial model.
- Compare pilot results and supplier service commitments rather than relying only on purchase price.
Chemical-free treatment is not automatically the least expensive option in every application. High-pressure membranes, advanced controls, or specialised media can require substantial investment. Yet when reduced chemical use, lower waste, simpler logistics, and efficient operation are combined, the long-term balance can favour a carefully designed chemical-free system.
Evaluate your water source, flow requirements, operating constraints, and five- to fifteen-year ownership costs with a qualified treatment specialist. A site-specific assessment can identify the practical route to safe drinking water while controlling energy use, waste, maintenance, and recurring expenditure.
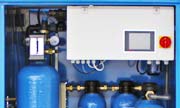
SCM 24
|
|
Cleans 24.000 liters per day
|
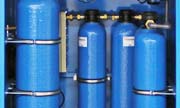
SCM 60
|
|
Cleans 60.000 liters per day
|
Video: How it works
The SCG Advantage
Our market-leading, water cleaning solutions have many advantages. To read more click the items below:
No Chemicals
Our machines and technology does not use any chemicals, at all.
Read more...
No Waste Water
Our machines do not waste any water. Yield = 100%.
Read more...
Low energy use
Uses 50 times less energy than a Reverse Osmosis Machine.
Read more...
Low ownership cost
Lower maintenance and operation costs due to our technology.
Read more...
Easy to install
Simple "plug and play" installation makes for easy deployment.
Read more...
Extremely compact
A compact system, contained in an easy to transport cabinet.
Read more...
Outperforms R.O.
SCG technologies outperform Reverse Osmosis systems.
Read more...
Faster ROI
Get a faster Return on Investment with our systems.
Read more...
Latest News
Latest Blog Posts
| Chemicals in water treatment? |
| Water storage - Whats best for keeping water clean and drinkable? |
| Case: Disaster Management Water Treatment |
Contact SCG
891 Showroom Place
Suite 101
Chula Vista, CA, 91914
Phone: +1 619-878-2730
Contact us by email