







Understanding Breakthrough Curves in Catalytic Filtration
Catalytic filtration is used to remove dissolved contaminants by combining a reactive filter surface with physical retention and adsorption. Depending on the media and water chemistry, a system may target iron, manganese, arsenic, uranium, pesticides, or other substances that conventional particle filtration cannot reliably capture.
A breakthrough curve shows how well that filter performs over time. It connects contaminant concentration in the treated water with the volume of water that has passed through the bed. This simple graph provides valuable information about media capacity, operating life, maintenance intervals, and the point at which treated-water quality begins to decline.
For water suppliers, farms, industrial operators, and remote facilities, understanding the curve supports better design decisions. It helps prevent premature media replacement while reducing the risk of allowing a contaminant to exceed its treatment target.
What The Breakthrough Curve Measures
The horizontal axis usually represents elapsed time, treated volume, or bed volumes. One bed volume is the amount of water needed to fill the active filter media. Expressing performance in bed volumes makes it easier to compare tests conducted with different vessel sizes or flow rates.
The vertical axis commonly shows the ratio between the contaminant concentration in the treated water and its concentration in the raw water. This is written as C/C₀, where C is the outlet concentration and C₀ is the inlet concentration. A low ratio indicates effective removal; a rising ratio signals that the filter is losing capacity.
At the beginning of a run, the outlet concentration may be close to zero. As the media becomes loaded, the curve rises gradually or sharply. The selected endpoint depends on the application. A drinking-water installation may define breakthrough at a regulatory limit, while a process-water system may use a different concentration based on equipment protection or product quality.
Why Catalytic Media Behaves This Way
Catalytic media accelerates reactions at its surface. In manganese removal, for example, a catalytic coating can promote the conversion of dissolved manganese into a filterable solid. Iron may undergo a similar oxidation and precipitation process. The resulting particles are captured within the media bed and removed during backwashing.
Other media work primarily through adsorption or ion exchange. Arsenic and uranium treatment depends strongly on oxidation state, pH, competing ions, and the specific active surface. Pesticide removal can involve adsorption into porous materials, with capacity determined by the compound’s properties and the water matrix.
The curve develops because the bed does not load uniformly. The upper portion of the media usually encounters the highest contaminant concentration first. A mass transfer zone then moves through the bed as adsorption sites or reactive surfaces become occupied. When this zone reaches the outlet, the treated concentration begins to increase rapidly.
Reading The Curve For Design Decisions
A complete performance test may identify three useful points: initial breakthrough, the treatment endpoint, and exhaustion. Initial breakthrough is the first measurable increase at the outlet. The endpoint is the concentration selected for operational control. Exhaustion occurs when the media provides little practical removal under the test conditions.
The distance between initial breakthrough and exhaustion reflects the shape of the mass transfer zone. A long, gradual rise may provide warning and allow flexible operation. A steep rise can leave little time to respond, making online monitoring and conservative replacement schedules especially important.
| Curve feature | What it indicates | Operational meaning |
|---|---|---|
| Low, stable C/C₀ | Strong contaminant removal | Normal service period |
| First rise in outlet concentration | Initial media loading limit is approaching | Increase monitoring |
| Rapid upward slope | Mass transfer zone is reaching the outlet | Prepare for switching or regeneration |
| Selected compliance endpoint | Maximum acceptable treated concentration | Define media replacement or maintenance |
| Near-inlet concentration | Practical exhaustion | Stop service or renew the bed |
Breakthrough volume is often reported as bed volumes treated before the chosen endpoint. This value should not be treated as universal. A media bed that lasts for thousands of bed volumes in one well may perform very differently in another source because of pH, alkalinity, dissolved oxygen, competing contaminants, or hydraulic conditions.
Operating Factors That Shift Performance
Empty bed contact time is one of the most important design variables. Slower flow gives water more time to contact catalytic surfaces and can improve removal, although an excessively low rate may affect system economics. A high flow rate can shorten the mass transfer zone and push the breakthrough point forward.
Influent concentration also affects service life. A sudden increase in manganese, arsenic, or organic matter can consume available capacity more quickly. Seasonal changes in groundwater quality, well operation, rainfall, or agricultural activity may therefore alter the expected curve.
Water chemistry can be equally significant. pH influences oxidation reactions and adsorption, while phosphate, silicate, hardness, iron, and natural organic matter may compete for active sites or block media surfaces. Temperature, dissolved oxygen, turbidity, and pre-existing solids can change both reaction efficiency and pressure loss.
Backwashing has two distinct roles. It removes accumulated solids and restores hydraulic permeability, but it may not restore adsorption capacity or the full chemical activity of a loaded medium. A filter can therefore have acceptable pressure loss after backwashing while still approaching contaminant breakthrough.
Applying Curve Data To Real Water Systems
A reliable design begins with representative raw-water testing. Samples should cover expected variation rather than relying on a single laboratory result. The analysis may include target contaminants, pH, alkalinity, conductivity, turbidity, iron, manganese, organic matter, and other constituents known to interfere with treatment.
For groundwater projects, the curve should be connected to the full treatment train, including aeration, prefiltration, catalytic media, disinfection, and post-treatment where required. Swiss Cleanwater Group describes solutions for groundwater treatment systems that can be evaluated against the source-specific contaminant profile and operating requirements.
Agricultural applications require additional care because water quality affects both crops and equipment. In hydroponic systems, trace metals, pesticides, and microbial contamination can damage plants or disturb nutrient management. The company’s hydroponic farming guidance illustrates why treatment targets must be matched to the intended use rather than selected from a generic contaminant list.
From Pilot Testing To Reliable Operation
Pilot testing turns a theoretical breakthrough curve into an operating plan. A representative column should use the proposed media, approximate bed depth, target flow rate, and realistic water chemistry. Operators can then record inlet and outlet concentrations at defined intervals and calculate treated bed volumes.
Sampling frequency should increase as the curve begins to rise. Online instruments may provide continuous readings for parameters such as turbidity, conductivity, oxidation-reduction potential, or selected metals, while laboratory testing confirms compliance for contaminants that cannot be measured economically in real time.
The test should also document pressure drop, backwash frequency, media loss, and any changes in pH or dissolved oxygen. These factors can reveal that a filter is hydraulically overloaded even before chemical breakthrough occurs. The final design should include a safety margin, alarm points, and a clear response procedure for rising outlet concentrations.
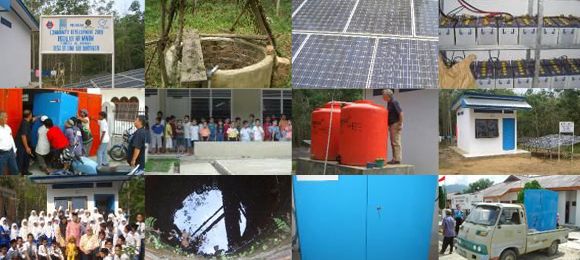
Field experience can help validate these choices, particularly where access, power, and maintenance resources are limited. A remote village case study demonstrates the importance of matching water-treatment technology to local operating conditions, infrastructure, and long-term service needs.
Practical Steps For Better Filter Management
A breakthrough curve becomes most useful when it is incorporated into routine operational control. The following practices help translate laboratory data into dependable treatment:
- Establish the operating endpoint from health, regulatory, process, or agricultural requirements.
- Record inlet concentration, outlet concentration, flow rate, pressure loss, and backwash events.
- Use bed volumes alongside calendar time so changing demand does not obscure media loading.
- Increase sampling frequency when the outlet concentration begins to rise.
- Reassess the curve after major changes in raw-water chemistry, flow, temperature, or media condition.
Operators should also distinguish between a capacity problem and a hydraulic problem. A rapid pressure increase may call for better pretreatment or more effective backwashing, while a rising contaminant concentration at normal pressure may indicate media exhaustion or altered water chemistry. Treating both problems as simple filter clogging can lead to incorrect maintenance decisions.
The strongest performance record combines laboratory results, pilot data, and field measurements. Over time, these records can reveal seasonal patterns and support a replacement schedule based on actual contaminant loading rather than an arbitrary service interval.
A breakthrough curve is ultimately a decision-making tool. It shows when a catalytic filter is working, how much useful capacity remains, and how quickly the system may approach its treatment limit. Careful interpretation helps protect drinking-water quality, extend media life, and maintain stable performance across municipal, agricultural, industrial, and remote installations.
For a source-specific assessment, Swiss Cleanwater Group can help connect contaminant analysis, catalytic filtration technology, monitoring requirements, and practical system design. Review the relevant treatment options and contact the company to develop a testing and operating plan suited to the water source.
SCM 24

|
|
Cleans 24.000 liters per day
|
SCM 60
|
|
Cleans 60.000 liters per day
|
Video: How it works
The SCG Advantage
Our market-leading, water cleaning solutions have many advantages. To read more click the items below:
No Chemicals
Our machines and technology does not use any chemicals, at all.
Read more...
No Waste Water
Our machines do not waste any water. Yield = 100%.
Read more...
Low energy use
Uses 50 times less energy than a Reverse Osmosis Machine.
Read more...
Low ownership cost
Lower maintenance and operation costs due to our technology.
Read more...
Easy to install
Simple "plug and play" installation makes for easy deployment.
Read more...
Extremely compact
A compact system, contained in an easy to transport cabinet.
Read more...
Outperforms R.O.
SCG technologies outperform Reverse Osmosis systems.
Read more...
Faster ROI
Get a faster Return on Investment with our systems.
Read more...
Latest News
Latest Blog Posts
| Chemicals in water treatment? |
| Water storage - Whats best for keeping water clean and drinkable? |
| Case: Disaster Management Water Treatment |
Contact SCG
891 Showroom Place
Suite 101
Chula Vista, CA, 91914
Phone: +1 619-878-2730
Contact us by email