







How To Monitor Contaminant Removal Efficiency In Chemical-Free Filters
Chemical-free water treatment can reduce manganese, arsenic, bacteria, pesticides and uranium without routine dosing, hazardous by-products or excessive energy consumption. Its performance still needs disciplined monitoring. A filter may appear to produce clear water while a dissolved contaminant is beginning to pass through, so visual checks alone are not enough.
For Australian operators, the monitoring programme should connect water quality results with flow, pressure, filter age and seasonal changes. A council plant in regional New South Wales, a rainwater system in Perth, an irrigation enterprise near the Murray–Darling Basin and a hospital in Melbourne may all require different sampling frequencies, even when they use similar purification equipment.
Define The Removal Target
Start by identifying the contaminants that matter at the intake and the quality required at the point of use. A baseline sample should include raw water and treated water, with laboratory testing for the substances relevant to the site. Depending on the source, this could include arsenic, manganese, uranium, E. coli, total coliforms, pesticide residues, turbidity, colour, pH, conductivity and hardness.
Calculate removal efficiency for each contaminant using the influent and effluent concentrations:
Removal efficiency (%) = [(influent concentration − effluent concentration) ÷ influent concentration] × 100
The calculation is useful, but it should not replace compliance limits. A 90 per cent reduction may sound strong while still leaving arsenic or bacteria above the applicable health-based value. Record results against the Australian Drinking Water Guidelines and the requirements of the relevant state or territory regulator.
The target should include a performance buffer. A filter operating close to the limit has little protection against a sudden rise in raw-water contamination. Agricultural runoff after heavy rain, changing bore chemistry or a seasonal algal event can alter the load quickly. Establish alert and critical limits before the system is commissioned.
Build A Sampling And Sensor Plan
Sampling locations should cover the raw-water inlet, post-treatment outlet and, where relevant, storage tanks and distribution points. A sample taken immediately after the filter may differ from water at a distant tap because of biofilm growth, pipe corrosion or stagnation. Healthcare facilities and public buildings therefore need a broader plan than a small rural installation.
Continuous instruments can track turbidity, flow, pressure differential, conductivity, temperature and sometimes oxidation-reduction potential. These readings provide early evidence of fouling, channeling, media exhaustion or an abnormal source-water event. They do not directly measure every contaminant. Arsenic, uranium, pesticides and many microbial indicators generally require validated laboratory methods or approved rapid tests.
Sampling frequency should reflect risk. A new installation may need frequent testing during commissioning, followed by a stable routine once several operating cycles have been documented. Increase sampling after maintenance, media replacement, flooding, a major change in flow or a raw-water incident. Keep chain-of-custody records, calibration certificates and laboratory detection limits with the operating log.
Read Filter Behaviour Between Tests
Pressure loss across the vessel is a practical indicator of suspended solids accumulation or biological growth. A rising differential pressure can reduce the designed contact time and increase energy demand. Conversely, an unexpectedly low pressure drop may indicate bypassing, a damaged internal component or insufficient flow through the treatment media.
Flow rate is equally important. Excessive flow can shorten contact time and reduce adsorption or oxidation performance, while a very low flow may encourage stagnation. Compare actual flow with the validated operating range, and review readings during peak demand. Australian households often use more water during hot summer mornings, while farms may create sharp irrigation peaks that change filter loading within hours.
Backwash or cleaning records should be analysed alongside water-quality results. A filter that needs increasingly frequent cleaning may be receiving a higher solids load or experiencing upstream deterioration. Record media depth, replacement dates, valve operation, pump status and any bypass events. Chemical-free does not mean maintenance-free: physical cleaning, media renewal and hygienic controls remain essential.
For systems protecting people from pathogens, monitoring must include the whole treatment train and the building network. Guidance on Legionella control is particularly relevant to hospitals, aged-care facilities and large commercial buildings where warm-water systems and low-use outlets can create additional risks.
Verify Results Against Australian Conditions
The Australian Drinking Water Guidelines provide a national reference, while implementation is managed through state and territory frameworks, water authorities and site-specific approvals. A project should document which regulator, operating licence, public-health plan or customer specification applies. For example, a municipal supplier and a private bore serving a food-processing site may face different reporting and verification duties.
Source-water context matters. Perth relies heavily on groundwater and climate-sensitive supplies, so dissolved minerals and seasonal recharge can influence treatment. Catchments supplying Sydney, Brisbane and regional communities may experience turbidity and microbial changes after intense rainfall. Farming areas in Victoria, South Australia and New South Wales can encounter pesticide or nutrient movement from treated land and irrigation drainage.
Rainwater tanks are common around Australian homes, rural properties and community buildings. A clear tank or pleasant taste does not demonstrate microbiological safety, particularly after bird activity, roof contamination or a long dry period. Test the water at the intended point of consumption and inspect first-flush devices, screens, tank hygiene and plumbing connections.
A useful local example is a treatment system receiving agricultural runoff. The organic farm case study shows why contaminant monitoring should follow the source profile rather than rely on a generic testing package. Pesticides can occur as short-lived peaks, so event-based sampling after rainfall may reveal a risk that monthly samples miss.
Turn Monitoring Into Operational Decisions
Create a simple response matrix that links each result to an action. An elevated turbidity reading may call for inspection of pre-filtration and backwashing. A pressure alarm may require flow reduction or a media check. A confirmed contaminant breakthrough should trigger isolation, resampling, investigation of the cause and notification under the applicable management plan.
Trend analysis is more valuable than isolated numbers. Plot influent concentration, treated concentration, removal percentage, flow, pressure differential and days since cleaning on the same timeline. Gradual deterioration often appears in the relationship between these values before a final sample exceeds a limit. Use consistent sampling points and laboratory methods so that changes reflect the water system rather than inconsistent testing.
Independent verification should be built into commissioning and periodic review. Compare online instruments with laboratory results, check sensor calibration and retain samples when practical. Operators should review alarms, missed samples and corrective actions at regular meetings. Larger facilities may benefit from a secure dashboard, while a farm or small community system can use a controlled spreadsheet with clear sign-off responsibilities.
| Monitoring element | What it can reveal | Typical response |
|---|---|---|
| Influent and effluent laboratory tests | Actual contaminant reduction and possible breakthrough | Confirm results, assess compliance and investigate the treatment stage |
| Turbidity and particle trend | Solids loading, poor pre-treatment or channeling | Inspect upstream screens, backwash system and filter internals |
| Pressure differential | Fouling, biological growth or restricted flow | Adjust flow, clean the unit or replace media when required |
| Flow and contact time | Overloading or insufficient treatment exposure | Rebalance pumps, valves and demand periods |
| Microbial testing | Bacterial contamination in source or distribution system | Isolate affected sections, investigate hygiene and resample |
| Calibration and maintenance records | Reliability of the monitoring programme | Recalibrate instruments and close documentation gaps |
Swiss Cleanwater Group supports projects across municipal, agricultural, industrial, livestock, building and mobile applications. Operators can use the company’s office network to discuss site-specific sampling, performance verification and system servicing requirements.
A well-designed monitoring programme turns clean-water equipment into a controlled treatment process. Define the contaminants, measure both chemistry and operating conditions, respond to trends early and align the records with Australian health and regulatory expectations. Contact Swiss Cleanwater Group to assess your source water, establish suitable performance indicators and develop a practical verification plan for your chemical-free filtration system.
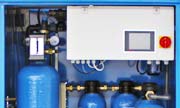
SCM 24
|
|
Cleans 24.000 liters per day
|
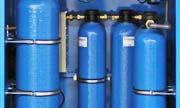
SCM 60
|
|
Cleans 60.000 liters per day
|
Video: How it works
The SCG Advantage
Our market-leading, water cleaning solutions have many advantages. To read more click the items below:
No Chemicals
Our machines and technology does not use any chemicals, at all.
Read more...
No Waste Water
Our machines do not waste any water. Yield = 100%.
Read more...
Low energy use
Uses 50 times less energy than a Reverse Osmosis Machine.
Read more...
Low ownership cost
Lower maintenance and operation costs due to our technology.
Read more...
Easy to install
Simple "plug and play" installation makes for easy deployment.
Read more...
Extremely compact
A compact system, contained in an easy to transport cabinet.
Read more...
Outperforms R.O.
SCG technologies outperform Reverse Osmosis systems.
Read more...
Faster ROI
Get a faster Return on Investment with our systems.
Read more...
Latest News
Latest Blog Posts
| Chemicals in water treatment? |
| Water storage - Whats best for keeping water clean and drinkable? |
| Case: Disaster Management Water Treatment |
Contact SCG
891 Showroom Place
Suite 101
Chula Vista, CA, 91914
Phone: +1 619-878-2730
Contact us by email